-
- Gold price licks its wounds after two-week downtrend, defends Friday’s corrective bounce.
- Firmer United States data, Treasury bond yields favor US Dollar and weigh on XAU/USD amid hawkish Federal Reserve bets.
- US debt ceiling talks remain inconclusive but Biden Official appears confident.
- US PMIs, Core PCE Price Index and FOMC Minues are also important for the Gold price directions.
Gold price (XAU/USD) picks up bids to extend Friday’s corrective bounce off a seven-week low as it benefits from the United States debt ceiling drama, as well as mixed comments from Federal Reserve (Fed) Chairman Jerome Powell, ahead of the key data/events. That said, the yellow metal dropped in the last two consecutive trading weeks while ending Friday on a positive note amid a pullback in the US Dollar.
It’s worth noting that the recent rebound in the XAU/USD remains elusive as the USD cheers hawkish Fed bets and the United States policymakers are hopeful of avoiding the US default. Also, a likely improvement in this week’s Purchasing Managers’ Index (PMI) and Fed’s favorite inflation gauge, namely the Core Personal Consumption Expenditure (PCE) Price Index for April, challenges the Gold price.
AdvertisementsGold price justifies haven status as United States default, Federal Reserve Minutes loom
Gold price recently benefits from the market’s uncertainty about the United States debt ceiling extension. The reason could be linked to the absence of any major announcements from the US policymakers. “US President Joe Biden and House Republican Speaker Kevin McCarthy will meet to discuss the debt ceiling on Monday, after a “productive” phone call as the president headed back to Washington,” Reuters quotes to sides. It should be noted that Republicans were less optimistic and paused the talks earlier in the weekend.
AdvertisementsOn the other hand, Federal Reserve Chairman Jerome Powell highlighted inflation fears on Friday but also stated that the recent banking crisis, which led to tighter credit standards, has eased the pressure to hike interest rates. The same weighed on the hawkish Fed bets and allowed the US Dollar bulls to take a breather, which in turn favored the Gold price to recover ahead of the key data/events.
AdvertisementsOn the same line, Minneapolis Federal Reserve Bank President Neel Kashkari ruled out market expectations that the Fed is done hiking interest rates in an interview with the Wall Street Journal (WSJ). The policymaker also said that he could support holding interest rates steady at the Fed’s next meeting.
AdvertisementsIt should be noted that the market’s bets of a 0.25% Fed rate hike in June have recently increased and the calls for a rate cut in 2023 have gone down due to the last week’s upbeat United States economics and hawkish comments from the Federal Reserve (Fed) officials. As a result, the Gold price dropped in the last week, apart from witnessing a bounce on Friday. Additionally helping the XAU/USD could be the latest retreat in the US Dollar and the looming fear of US default amid mixed messages from the US policymakers, as stated above.
Multiple catalysts to watch for XAU/USD directions
While the Gold traders are more concerned with the US debt ceiling announcements and the Federal Open Market Committee (FOMC) meeting minutes, preliminary readings of the May month Purchasing Managers Indexes (PMIs) and the Federal Reserve’s favorite inflation gauge will also be important to watch for immediate XAU/USD directions.
Given the recently firmer US data and hawkish Fed talks, any improvement in the US PMIs and/or Core PCE Price Index for April may exert downside pressure on the Gold price. However, it all depends upon how well the US policymakers manage to tackle the impending default fears.
Gold price technical analysis
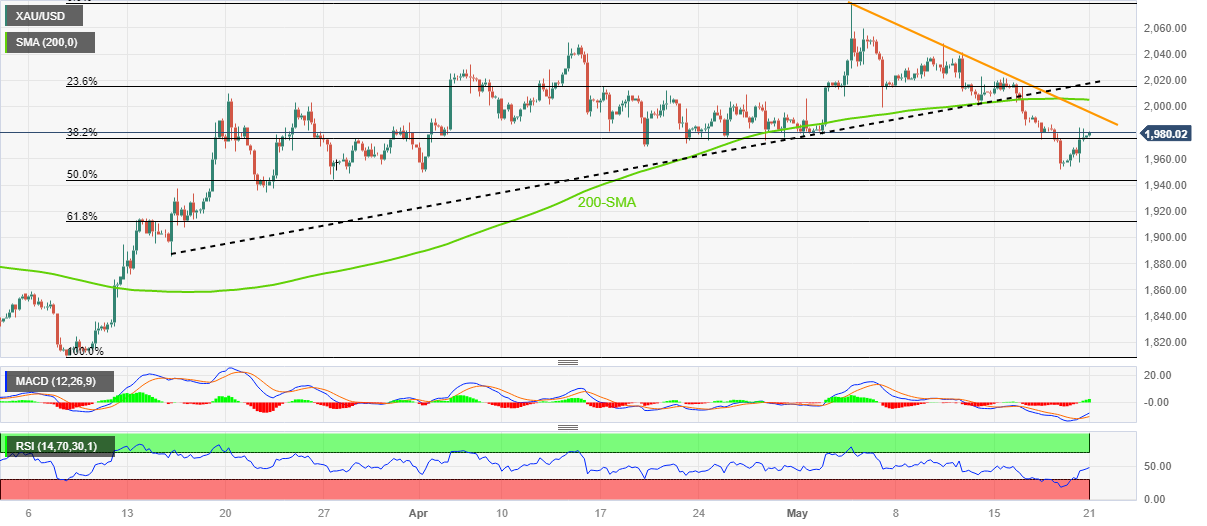
Despite positing the consecutive second weekly loss, the Gold price closed positive on Friday, grinding higher of late.
That said, the Gold price recovery also takes clues from the Relative Strength Index (RSI) line, placed at 14, as it rebounds from the oversold territory. Adding strength to the upside bias are the bullish signals from the Moving Average Convergence and Divergence (MACD) indicator.
It’s worth noting, however, that a 13-day-old descending resistance line, close to $1,998, precedes the 200-bar Simple Moving Average (SMA), near $2,005 by the press time, to restrict the short-term upside of the XAU/USD.
Following that, the previous support line from mid-March, around $2,016-17, appears the key for the Gold buyers to cross to retake control. Even so, April’s high near $2,049 and the $2,050 round figure, may prod the XAU/USD upside ahead of directing the metal buyers towards the previous yearly high near $2,070 and the recently flashed record high around $2,080.
On the flip side, the last weekly low of around $1,950 holds the key to the Gold bear’s entry.
Even so, the 50.0% and 61.8% Fibonacci retracement level of the Gold price upside from March to May, around $1,943 and $1,911 in that order, can act as an extra filter towards the south.
Overall, the Gold price remains on the bear’s radar below $2,017 even if a short-term recovery is expected.
Gold price: Four-hour chart

Trend: Limited recovery expected
Gold Price Forecast: XAU/USD rebound hinges on US debt ceiling talks, inflation clues and Fed Minutes

235
Advertisements
previous post