Gold, XAU/USD, US CPI, FOMC, Fed, Treasury Yields, US Dollar, – Talking Points
- The gold price slid on the back of US CPI data lifting Treasury yields
- While the direction of CPI is improving, there might be more work to do
- Fed language later today will be scrutinised for hints on future rate moves
Gold has broken lower in the aftermath of US CPI figures that undermined the US Dollar and lifted Treasury yields ahead of today’s Federal Open Market Committee (FOMC) meeting.
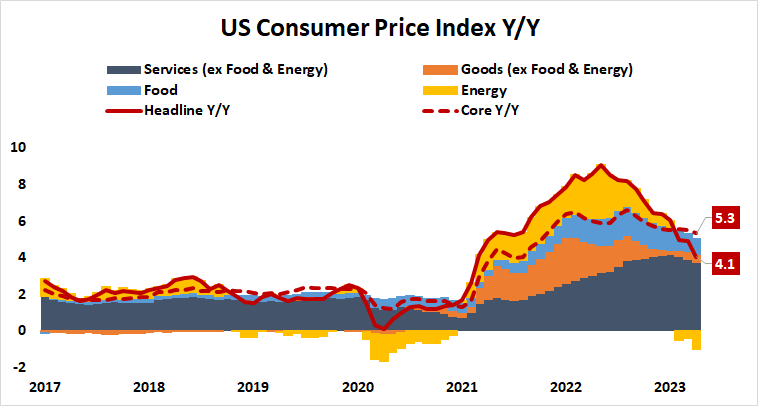
The monthly headline CPI gauge for May was 0.1% as anticipated against 0.4% previously to give a year-on-year number of 4.0%, slightly less than forecasts of 4.1% and 4.9% prior.
Looking at core CPI, it was 0.4% month-on-month for May, which was in line with expectations. Year-on-year it was 5.3%, a slight beat on the 5.2% anticipated and slightly below 5.5% prior.
The significant drop in the headline rate can be attributed to a base effect with the May 2022 monthly read of 0.9% dropping out of the data set.
Looking at the chart below, this outcome could be mostly attributed to the drop in the energy component of the data, which might be seen as impacted by changes in supply rather than demand.
Nonetheless, headway has been made in getting the drift of inflation going in the right direction. The absolute level of price pressures remains problematic, but it appears that the Fed might ‘skip’ a hike at its pow-wow later today.
The Fed’s target of 2% annual inflation is still some way off but by the time the July FOMC gathering rolls around, they will have another set of economic data points to reference.
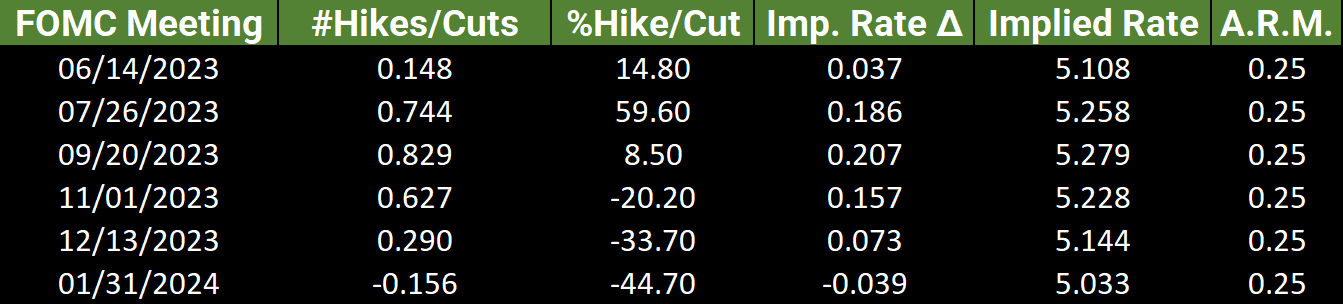
In any case, swaps and futures interest rate markets are pricing in no change for today but around a 75% chance of a 25 basis point lift at either the July or September meetings.
For gold, the uptick in Treasury yields may have played a role in the weakness seen overnight. The larger gains were seen in the 2- to 10-year part of the curve while the 1-year note remains near 23-year highs.
Additionally, the core component of the inflation data could indicate that some stickiness persists for high CPI. If inflation pressures linger this might see a resumption of a more hawkish Fed in subsequent meetings.
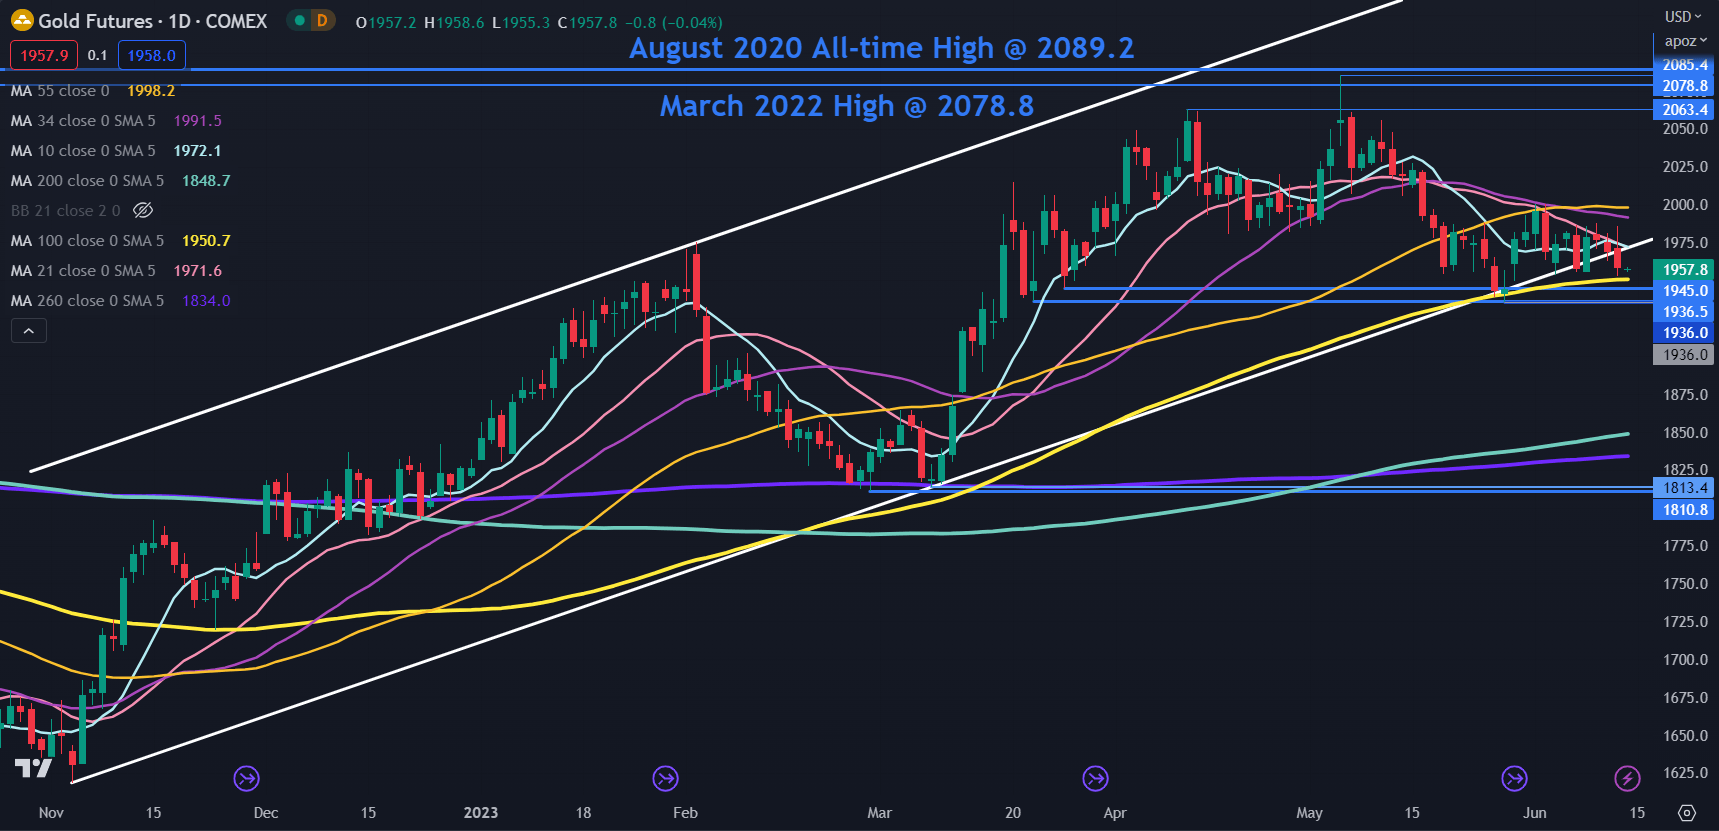
GC1 (GOLD FRONT FUTURES CONTRACT) TECHNICAL ANALYSIS
Gold has dipped below an ascending trend line again and might be at a crucial juncture in the coming sessions.
Below the price, the 100-day Simple Moving Average (SMA) currently lies just above prior lows in the 1936 – 1945 area which may provide a support zone. A clean break below those levels might see bearishness unfold.
On the topside, a sustained move above 2000 would clear all short, medium and long-term daily SMAs. This potentially suggests that bullish momentum could resume evolving if that target is achieved.