Gold prices have established a solid base above $2,650 against the US Dollar. Recently, prices surged, overcoming multiple obstacles near $2,700, and setting a new all-time high.
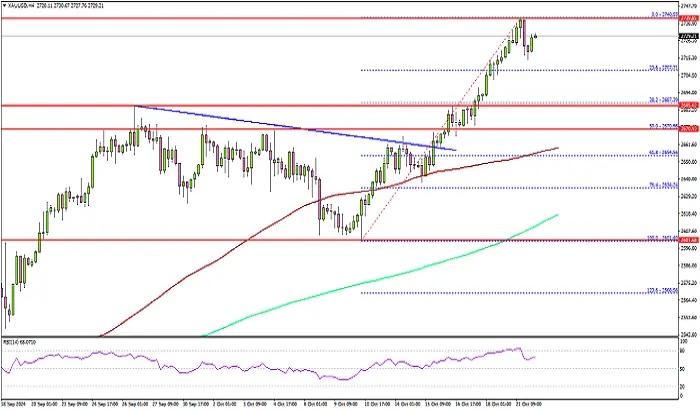
The 4-hour chart for XAU/USD shows that prices have broken through a significant bearish trend line at $2,660, entering a positive phase. A notable increase occurred above the $2,715 and $2,720 levels, with prices even surpassing $2,735 to reach the new peak.
Currently, prices are consolidating and remain well above the 23.6% Fibonacci retracement level from the $2,601 swing low to the $2,740 high, as well as above both the 100 Simple Moving Average (red) and the 200 Simple Moving Average (green) on the 4-hour chart.
On the downside, initial support is found near $2,710, with the first major support at $2,688. This level is close to the 38.2% Fibonacci retracement level for the upward move from the $2,601 low to the $2,740 high.
The key support level is now at $2,650. If prices drop below this support, further declines could follow, with the next major support around $2,620.
For the upside, immediate resistance is near the $2,740 level, while the first major resistance sits at $2,750. A clear breakout above $2,750 could pave the way for further gains, with the next major resistance possibly at $2,765, and prices could rally towards $2,780.
In terms of oil prices, they have faced challenges near the $72.50 resistance and remain at risk of falling below the $70.00 mark.
You Might Be Interested In
- Gold Prices Rise by Rs 750, Silver Surges by Rs 5,000
- Domestic Gold Bar Prices Hit Record High
- Mt Malcolm Mines Produces First Gold Doré Bars from Golden Crown Bulk Sampling


