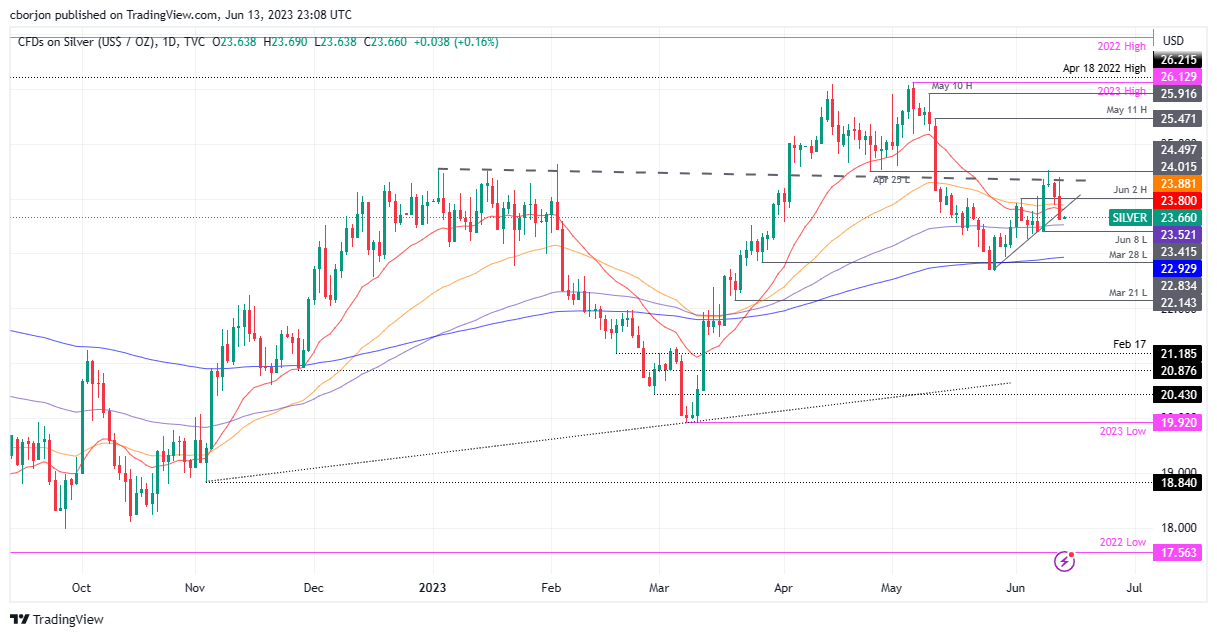
1.Silver falls past the $23.88/80 confluence of the 50 and 20-day EMAs.
2.Further losses could be seen if Silver breaks below the 100-day EMA at $23.52, with the next target being the June 8 low of $23.41.
3.On the upside, a break above $23.90 could pave the way toward the $24.00 level.
Silver price extended its losses past the confluence of the 20 and 50-day Exponential Moving Averages(EMAs) as higher US Treasury bond yields sparked a sell-off of the white metal. XAG/USD’s sellers targeted the 100-day EMA at $23.52 but could not achieve their goal. The XAG/USD trades at $23.68.
XAG/USD Price Analysis: Technical outlook
Silver tumbled below the $23.88/80 confluence of the 50 and 20-day EMAs, extending its losses past an upslope support trendline drawn since the beginning of June. Even though XAG/USD remains in consolidation, a drop below the 100-day EMA at $23.52 will send the white metal tumbling toward the June 8 low of $23.41 before challenging the $23.00 mark.
In that outcome, the XAG/USD’s next support would be the important 200-day EMA at $22.92, which, once cleared, would pave the way for additional losses.
For a bullish continuation, XAG/USD buyers must reclaim $23.90, so they can threaten to break $24.00. A breach of the latter will expose Silver to further buying pressure. XAG/USD can rally towards the next resistance at April 25 low-turned resistance at $24.49 before challenging $25.00.
XAG/USD Price Action – Daily chart