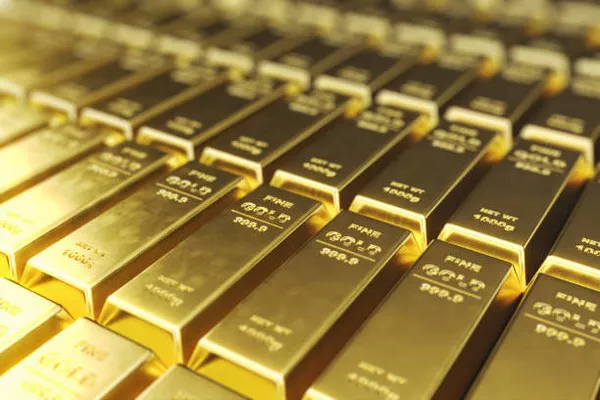
As the final week of September unfolds, some are wondering if history will repeat itself, mirroring the patterns observed in the previous year when gold rallied by $100 per ounce during this time frame. In 2022, gold then traded sideways for a month before embarking on a spectacular rally that extended from November to March.
History often exhibits recurring patterns, and some investors are looking to past trends for insights into gold’s future performance.
Analyzing the daily gold chart reveals growing recognition of gold’s remarkable relative strength in the face of rising U.S. interest rates. This strength has led to debates about a potential paradigm shift in the relationship between gold and interest rates.
One perspective suggests that the inverse relationship between gold and rates has been disrupted. On the contrary, others argue that the relationship remains largely intact, with gold establishing a new foundation for its next rally alongside declining rates.
The reality, it seems, encompasses both views, as gold maintains its status as the ultimate asset and currency.
The traditionally inverse relationship between rates and gold reached its peak during periods of quantitative easing (QE), zero/negative interest rates, and the deflationary trends from 2008 to 2020. However, the global economic landscape is undergoing a shift towards inflation, and transitions of power, especially in China, are becoming dominant themes. In China, where gold holds cultural significance, the narrative of “gold pays no interest” holds less sway.
During the 1970s, gold experienced a significant rally while interest rates soared, driven by the prevailing theme of inflation. Today, as inflation regains prominence, the relationship between rates and gold appears to be evolving.
Examining the key U.S. rates chart reveals signs of “bear wedge action” occurring as gold hovers around $1910. Comparatively, the relationship between rates and gold has weakened since last September when rates were at 4.33%, while gold was priced at $1620. Presently, rates stand at 4.56%, with gold at $1910.
From a technical perspective, U.S. rates seem to be entering a blowoff phase, while gold remains above significant support levels, including $1883, $1850, and $1810.
Ultimately, the outlook hinges on the potential collapse of rates when the blowoff phase concludes. Should this occur alongside a surge in oil prices to $100 or more, U.S. real interest rates, based on the nominal 10-year rate and the CPI, could turn significantly negative.
Mining stocks, often favored by Western gold enthusiasts, may require patience. While the short term may hold uncertainty about the durability of the bull rectangle’s lows, the remarkable resilience of gold amid the aggressive rise in rates hints at a potentially exciting and bullish future finale.


